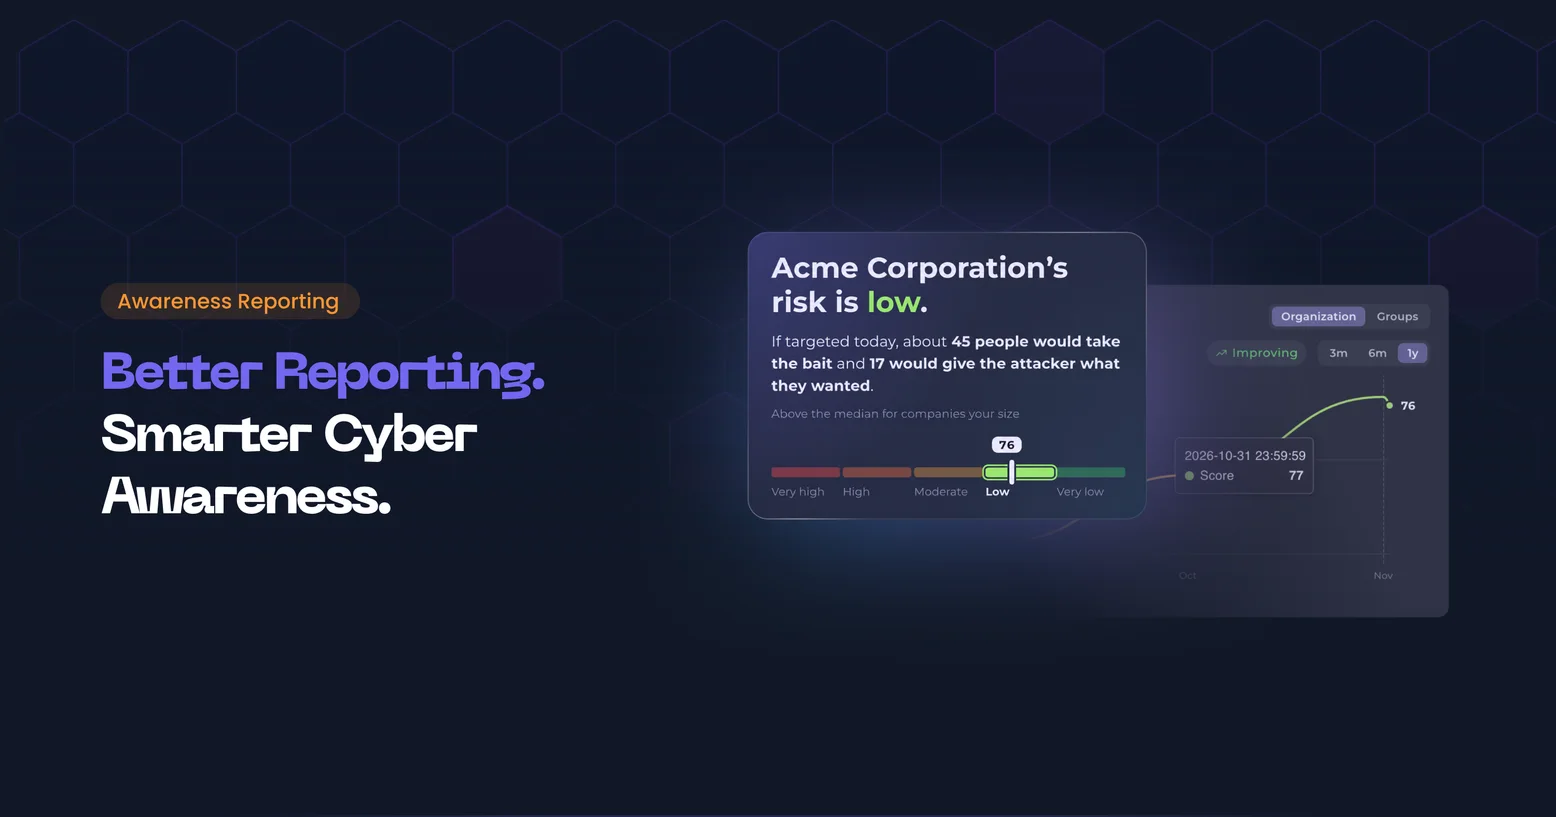
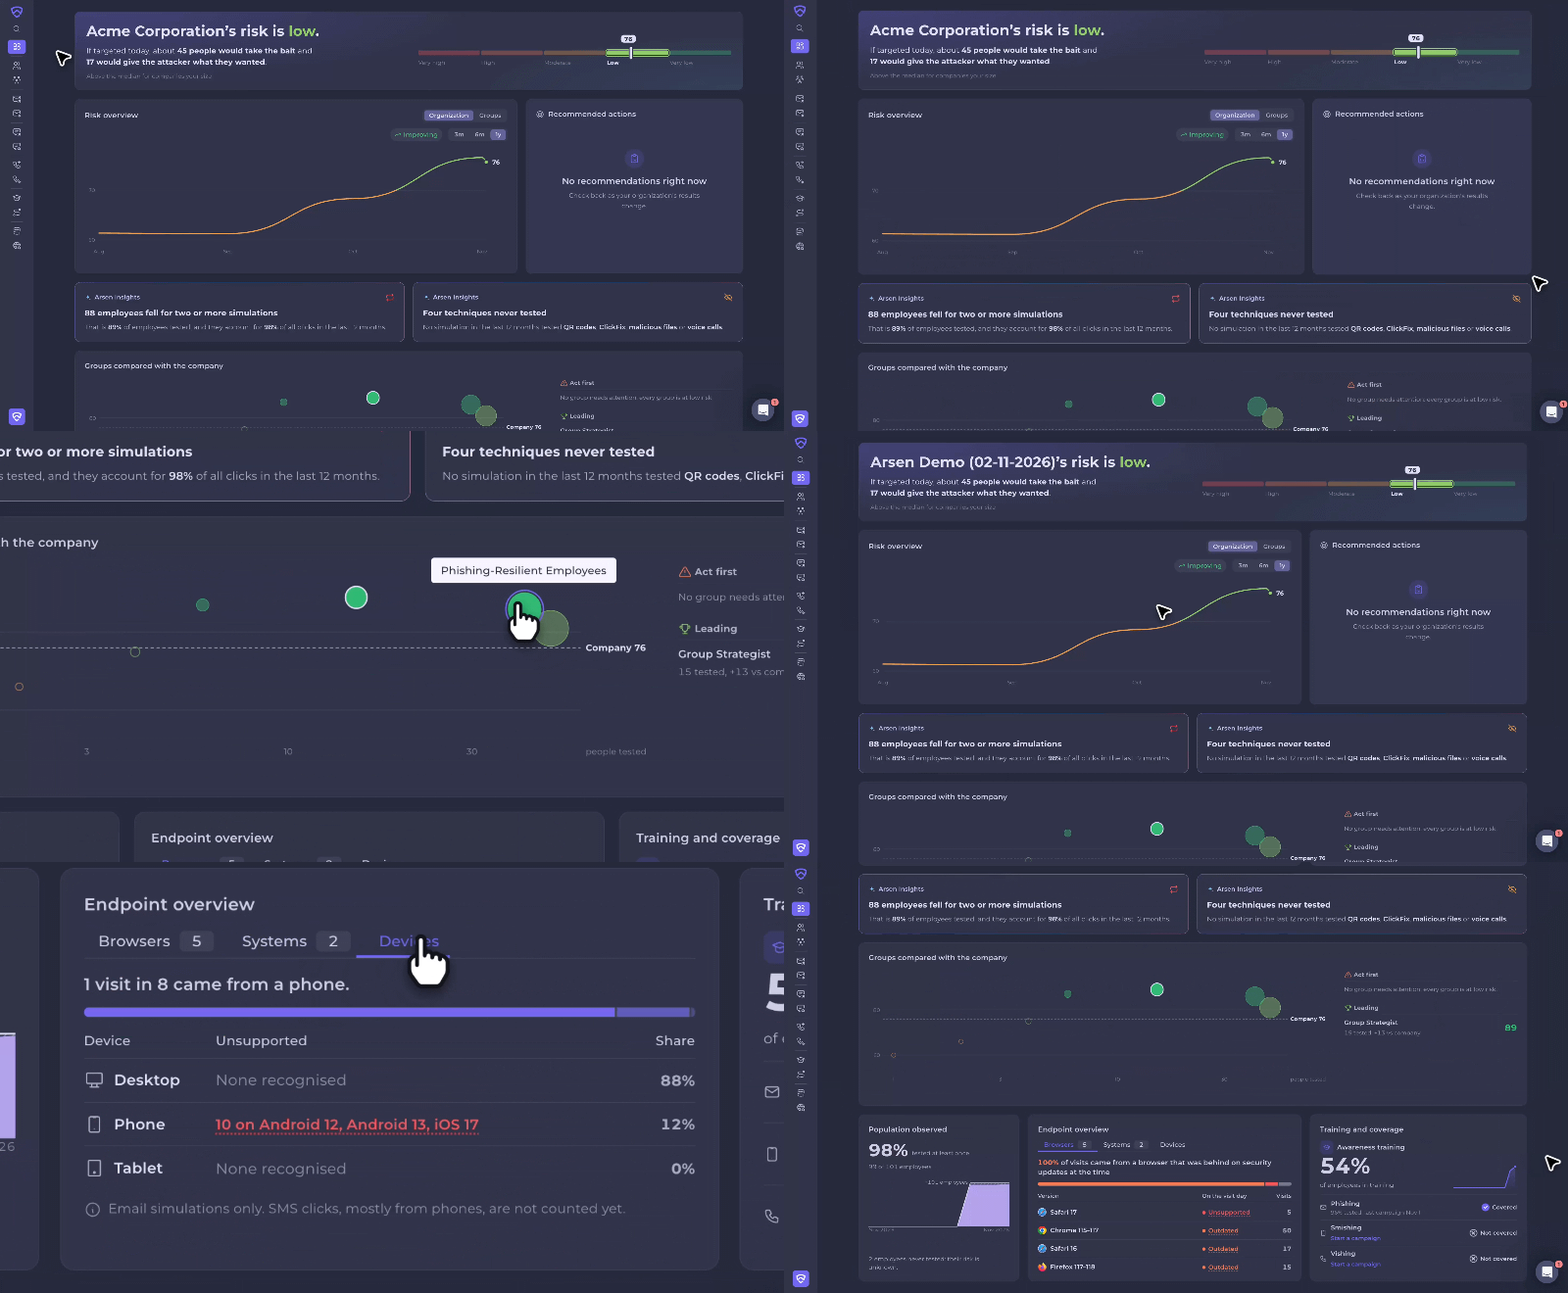
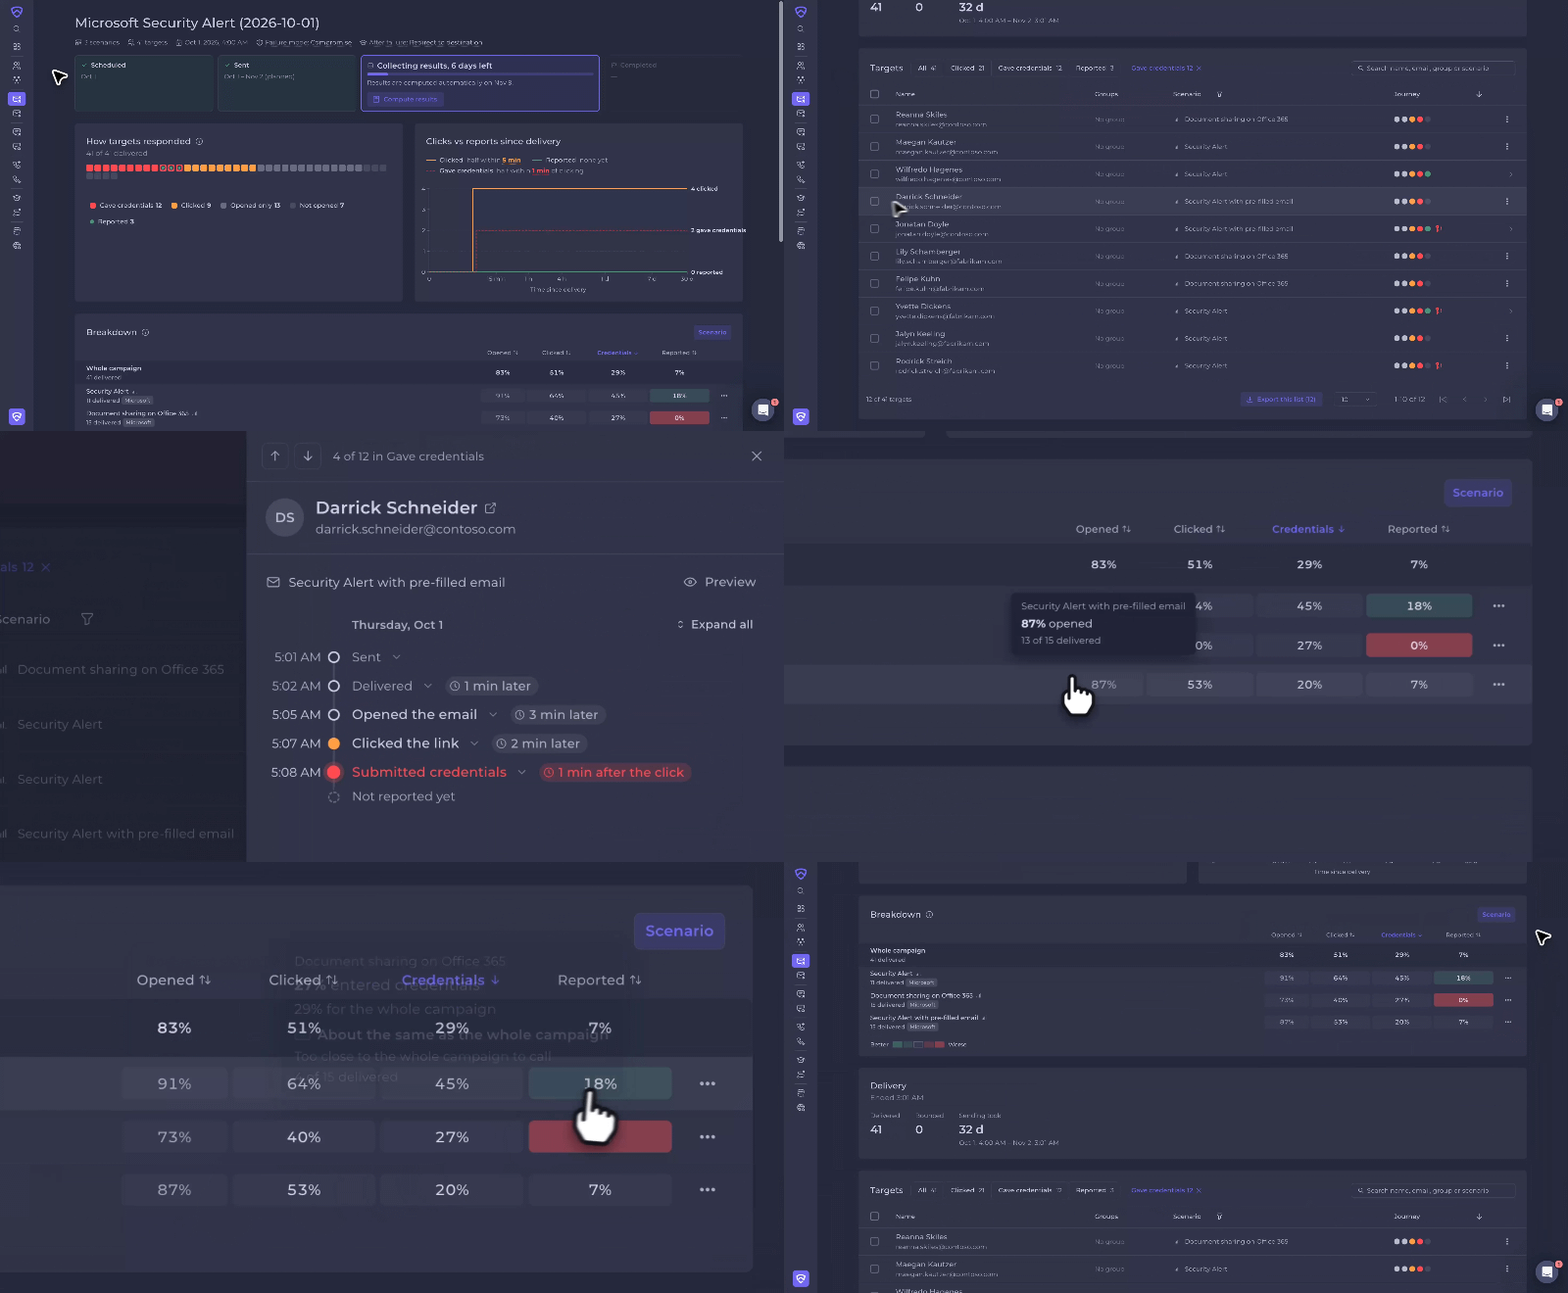
The Arsen dashboard answers three questions: how exposed your organization is, where the risk sits, and what to do next. The campaign page shows who did what in each phishing campaign, how fast, and what to do with each person.
What is human risk management?
Human risk management treats employee behavior as a measurable security risk. Instead of counting completed trainings, it measures how people react to realistic attacks such as phishing, vishing and deepfakes, tracks that exposure over time and by group, and directs testing and training to where the risk is highest. The output is a risk level a security team can explain, compare and reduce.
The dashboard: your organization's risk
The dashboard opens on a single sentence that states your risk, for example "Acme's risk is moderate." Below it, the score sits on a five-level scale, with its trend over the last 3 months and the median score of companies your size.
The five risk levels follow score bands: 0 to 40, 40 to 50, 50 to 60, 60 to 80, and 80 to 100. The benchmark is the median score of Arsen customers of similar size, captured each month. It shows where you stand, not a target to hit.
What the dashboard shows
| Block | What it shows | What you do with it |
|---|---|---|
| Risk summary | Your risk in one sentence, the score on five levels, the 3-month trend and the peer median | Report your exposure in one line |
| If targeted today | How many people would take the bait in a real attack, and how many would give the attacker what they wanted | Translate the score into a concrete outcome |
| Score history | Your score over 3 months, 6 months or 1 year, drawn over the five risk levels | Track progress over a period |
| Who has been tested | How many employees have been tested at least once | Find the risk you cannot measure yet |
| Groups compared with the company | Groups ranked against the company score, with Act first and Leading groups, and a map of the largest groups by headcount and risk | Pick the group to address first |
| Recommended actions | The next step to take, prepared as a campaign in one click | Run the follow-up that moves the score most |
| Arsen Insights | Findings flagged automatically from your results | Adjust your testing strategy |
| Training and coverage | For each module, the share of employees covered and the date of the last campaign | Spot modules that are idle or not yet started |
| Endpoint overview | Browsers, systems and devices used to open simulations, and which were behind on security updates | Notify the people on outdated systems |
If targeted today
Based on the last 12 months of results, the dashboard estimates what a real attack would do to your organization today, for example: "If targeted today, about 27 people would take the bait and 11 would give the attacker what they wanted."
The estimate takes each employee's latest result on each channel over the last 12 months and applies it to the whole workforce. If fewer than 20 employees, or under 30% of the workforce, were tested, the dashboard says so instead of guessing.
Groups, recommended actions and insights
Groups are ranked against the company score. Groups that cover most of the company, or have too few people tested, are left out of the comparison, since comparing them would be misleading.
The Recommended actions card points to the group, technique or module that will move the score most:
- Coverage: test employees who have never been tested.
- Groups: follow up with a group whose score sits well below the company.
- Modules: start a module your organization has access to but has not used, such as vishing or awareness training.
One click prepares the campaign with the audience and name already filled in. A skipped suggestion comes back after a week if it still applies.
Arsen Insights flags findings that guide your testing strategy: no report button, techniques never tested (QR codes, ClickFix, malicious files, voice calls), a small group carrying a large share of the risk, employees who fell for two or more simulations, your weakest channel, and reporting that is improving.
Training and coverage, and Endpoint overview
Training and coverage shows, for awareness training, phishing and vishing, the share of employees covered and the date of the last campaign.
Endpoint overview lists the browsers, systems and devices employees used when they opened a simulation, and flags those that were behind on security updates on the day of the visit. Open a finding to see the people concerned, copy their emails or mark them as handled. The Endpoint overview and the group comparison replace the former device, browser and group cards, with the same information ranked by what needs attention first.
The campaign page: the result of one campaign
The campaign page opens on the result in one sentence, for example: "42 of 300 clicked (14%), 6 of them submitted credentials. 25 reported it." A timeline shows where the campaign is: scheduled, sending, collecting results or completed.
What the campaign page shows
| Block | What it shows |
|---|---|
| Result in one sentence | Clicks, submissions and reports, with a timeline of the campaign stage |
| Delivery | What was sent, delivered and bounced, and the sending curve against the plan |
| How targets responded | One square per target or set of targets, colored by what they did, with a marker for reports |
| Clicks against reports | Whether the first click or the first report came first, and how fast people clicked and reported |
| Breakdown | Each group, scenario or language compared with the whole campaign, from much better to much worse |
| Who did what | One-click filters on targets and a full timeline for each person |
How targets responded, and how fast
Each target is a square colored by what they did. On large campaigns, one square stands for several targets, from 1 to 100 depending on the size of the campaign. A marker shows a report, made with the report button or manually to an administrator. Click a square to open that person.
The clicks against reports chart shows whether the first click or the first report came first, and the speed of both. Reports that keep pace with clicks point to employees who catch the attempt early.
In the breakdown by group, scenario or language, each segment is compared with the whole campaign. Segments too small to compare are set aside instead of misleading you.
Who did what
Filter targets in one click with Gave credentials, Not reported or Needs training (clicked but did not finish the training). Each person has a full timeline of what happened, with device, browser and location, and the time between steps. Weak passwords are flagged with a key icon.
Act on the results
Select targets in the list, then:
- Add them to a group to re-test or train them later.
- Export the list.
- Mark someone as reported.
- Remove an event caused by a mail scanner.
Filtering on Gave credentials and adding those targets to a group is the shortest path to a follow-up campaign on the people most exposed.
Requirements
- Nothing to turn on: the dashboard is active for every organization.
- Campaign pages use this layout automatically.
- The If targeted today estimate needs at least 20 employees and 30% of the workforce tested over the last 12 months.
-
The dashboard shows your organization's human risk level in one sentence, its trend and its position against companies your size, an estimate of what a real attack would do today, groups ranked against the company, recommended next steps, automatic insights, training coverage and the endpoints employees used when they opened a simulation.
-
The Endpoint overview and the group comparison replace them. They show the same information, ranked by what needs attention first.
-
No. It needs enough results. If fewer than 20 employees, or under 30% of the workforce, were tested over the last 12 months, the dashboard says so instead of guessing.
-
No. The dashboard is active for every organization, and campaign pages use this layout automatically.